VPSのセットアップ
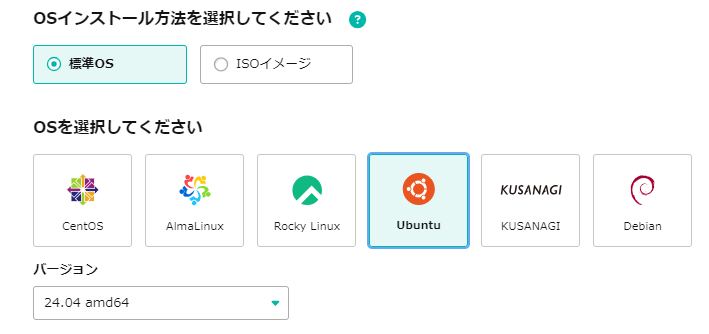
まずはSakura VPS 1GでUbuntu バージョンは24で構築。
SSHで自分のPCから接続します。
さくらのVPSを使ってシステム開発に必要な知識を学ぶ 〜第8回〜
上記記事を見ながら、webサーバーとしてnginxをインストールします。
nginxのインストール
$ sudo apt-get update -y
$ sudo apt-get install -y nginx
nginxの自動起動を確認
$ sudo systemctl is-enabled nginx
enable

// nginxが起動しているか確認
$ sudo systemctl status nginx
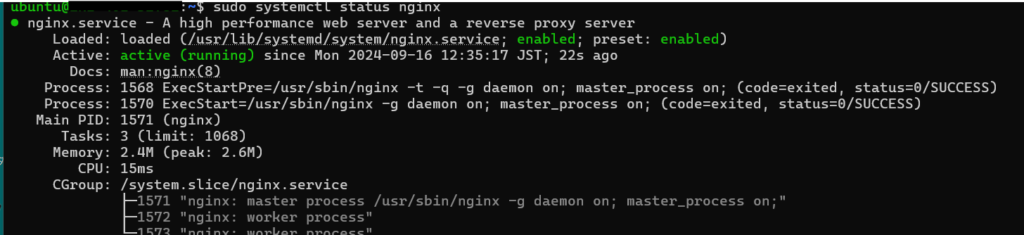
activateされていました。
ファイアウォールの設定
$ sudo ufw status
// もしactive でなかったら
$ sudo ufw enable
// ポートの設定
$ sudo ufw allow 'Nginx Full'
$ sudo ufw allow OpenSSH
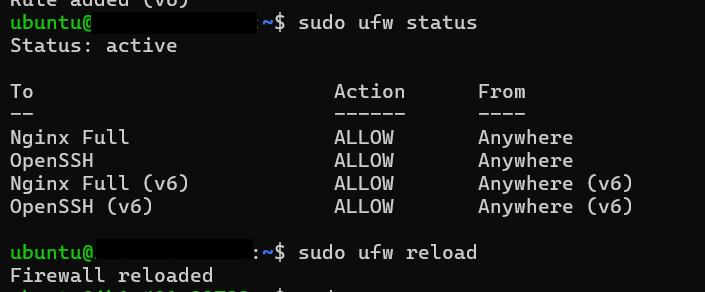
//確認
$ sudo ufw status
// リロード
$ sudo ufw reload
パケットフィルターの設定
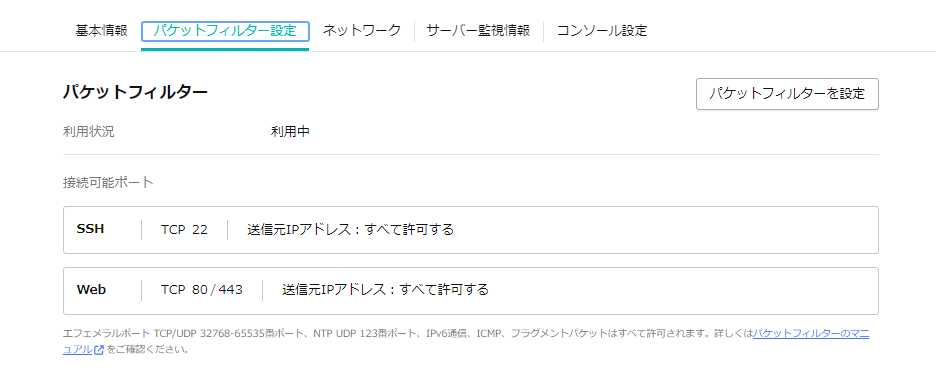
Web用の80/443をあけます。
ブラウザで確認
ブラウザでIPアドレスを入力
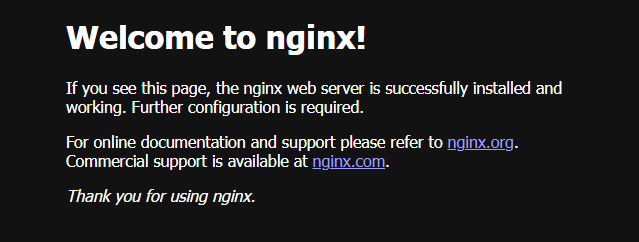
無事にnginxの画面が表示されました。
VS CodeからSSHで接続
VSCodeからSSHで接続します。
下記の記事を参考にしVS CodeにRemote SSHをインストール
https://qiita.com/nlog2n2/items/1d1358f6913249f3e186
自分のPCの c:\Users\自分\.ssh\config ファイルを編集
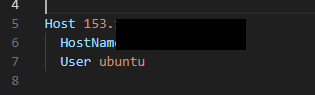
Remote SSHで接続する際の、HostとUserをこちらに記載します。
nginxのディレクトリ
IPアドレスにブラウザでアクセスしたときに表示されるファイルは
/var/www/html
こちらのフォルダにあります。
VS Codeのエクスプローラーでこのフォルダを開くには、まずはターミナルを開き、
$ cd /var/www/html
// フォルダに移動

//このままだとこのフォルダに対する権限がないので、

$ sudo chown -R ubuntu:ubuntu /var/www/html/
// これで権限設定。

$ code .
// こうするとVS Codeのエクスプローラーでこのフォルダを開くことができます
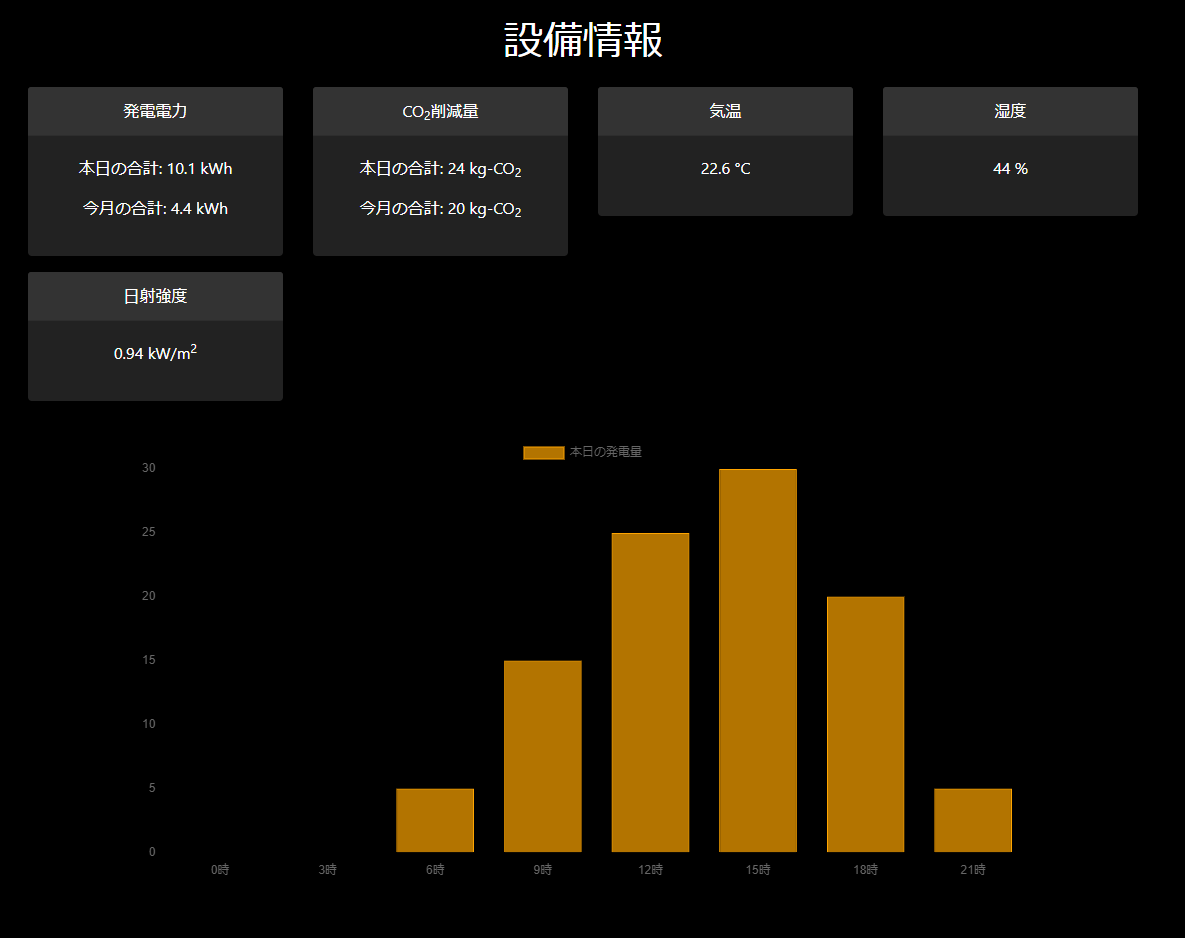
ダッシュボードの作成
VS Codeからindex.htmlを作成し、ダッシュボードのHTMLをペーストします。
<!DOCTYPE html>
<html lang="ja">
<head>
    <meta charset="UTF-8">
    <meta name="viewport" content="width=device-width, initial-scale=1.0">
    <title>リアルタイムセンサーデータ表示</title>
    <!-- BootstrapのCSSをCDNから読み込み -->
    <link href="https://stackpath.bootstrapcdn.com/bootstrap/4.5.2/css/bootstrap.min.css" rel="stylesheet">
    <!-- Chart.jsのCDNを読み込み -->
    <script src="https://cdn.jsdelivr.net/npm/chart.js"></script>
    <style>
        body {
            background-color: #000;
            color: #fff;
        }
        .card {
            background-color: #222;
            border: none;
        }
        .card-header {
            background-color: #333;
        }
        .chart-container {
            width: 80%;
            margin: 20px auto;
        }
    </style>
</head>
<body>
    <div class="container">
        <h1 class="text-center my-4">設備情報</h1>
        <div class="row">
            <div class="col-md-3 mb-3">
                <div class="card text-center">
                    <div class="card-header">発電電力</div>
                    <div class="card-body">
                        <p>本日の合計: <span id="daily-power">24.3</span> kWh</p>
                        <p>今月の合計: <span id="monthly-power">153.5</span> kWh</p>
                    </div>
                </div>
            </div>
            <div class="col-md-3 mb-3">
                <div class="card text-center">
                    <div class="card-header">CO<sub>2</sub>削減量</div>
                    <div class="card-body">
                        <p>本日の合計: <span id="daily-co2">96</span> kg-CO<sub>2</sub></p>
                        <p>今月の合計: <span id="monthly-co2">2466</span> kg-CO<sub>2</sub></p>
                    </div>
                </div>
            </div>
            <div class="col-md-3 mb-3">
                <div class="card text-center">
                    <div class="card-header">気温</div>
                    <div class="card-body">
                        <p><span id="temperature">25</span> °C</p>
                    </div>
                </div>
            </div>
            <div class="col-md-3 mb-3">
                <div class="card text-center">
                    <div class="card-header">湿度</div>
                    <div class="card-body">
                        <p><span id="humidity">31</span> %</p>
                    </div>
                </div>
            </div>
            <div class="col-md-3 mb-3">
                <div class="card text-center">
                    <div class="card-header">日射強度</div>
                    <div class="card-body">
                        <p><span id="solar-intensity">0.86</span> kW/m<sup>2</sup></p>
                    </div>
                </div>
            </div>
        </div>

        <div class="chart-container">
            <canvas id="powerChart"></canvas>
        </div>
    </div>

    <!-- jQueryとBootstrapのJSをCDNから読み込み -->
    <script src="https://code.jquery.com/jquery-3.5.1.slim.min.js"></script>
    <script src="https://cdn.jsdelivr.net/npm/bootstrap@4.5.2/dist/js/bootstrap.bundle.min.js"></script>

    <script>
        // データを更新する関数
        function updateSensorData() {
            document.getElementById('daily-power').innerText = (Math.random() * 30).toFixed(1);
            document.getElementById('monthly-power').innerText = (Math.random() * 200).toFixed(1);
            document.getElementById('daily-co2').innerText = Math.floor(Math.random() * 100);
            document.getElementById('monthly-co2').innerText = Math.floor(Math.random() * 3000);
            document.getElementById('temperature').innerText = (20 + Math.random() * 10).toFixed(1);
            document.getElementById('humidity').innerText = Math.floor(20 + Math.random() * 60);
            document.getElementById('solar-intensity').innerText = (Math.random() * 1).toFixed(2);
        }

        // 一定時間ごとにデータを更新
        setInterval(updateSensorData, 5000);

        // グラフの設定
        const ctx = document.getElementById('powerChart').getContext('2d');
        const powerChart = new Chart(ctx, {
            type: 'bar',
            data: {
                labels: ['0時', '3時', '6時', '9時', '12時', '15時', '18時', '21時'],
                datasets: [{
                    label: '本日の発電量',
                    data: [0, 0, 5, 15, 25, 30, 20, 5],
                    backgroundColor: 'rgba(255, 165, 0, 0.7)',
                    borderColor: 'rgba(255, 165, 0, 1)',
                    borderWidth: 1
                }]
            },
            options: {
                scales: {
                    y: {
                        beginAtZero: true,
                        max: 30
                    }
                }
            }
        });
    </script>
</body>
</html>
書き込んでブラウザからリロード

このように表示されました。
まとめ
以上、Sakura VPSを使って自作したダッシュボードを表示する方法を紹介しました。
次回はNode-REDでエンドポイントを作って、Node-REDのデータを表示させる方法を紹介します。