
Grafanaの準備
influxDBをインストール
insluxDBをシステムにダウンロードします。
sudo apt-get install influxdb
sudo apt-get install influxdb-client
influxDBを起動します。
sudo systemctl start influxdb
データベースの設定
コマンドプロンプトからinfluxDBのCLIを立ち上げます。
influx
データベースを作成します。
作成したデータベース名をGrafana側でも設定します。
CREATE DATABASE test_database;
GrafanaにinfluxDBをセット
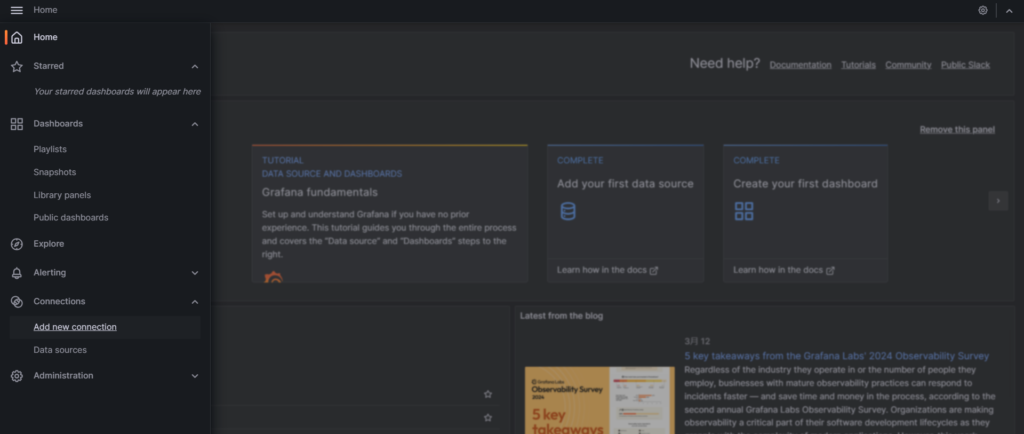
画面左上の「≡」からConnectionsのAdd new conectionを開きます。
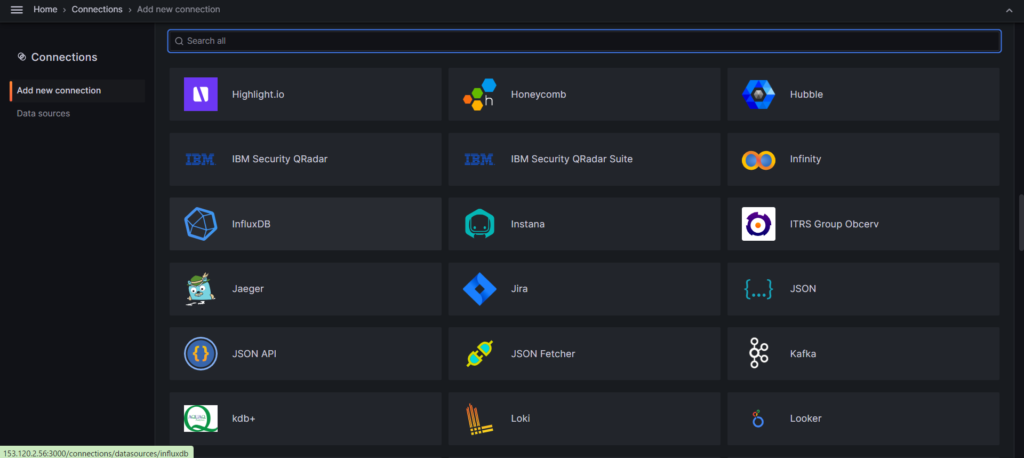
influxDBを選択します。
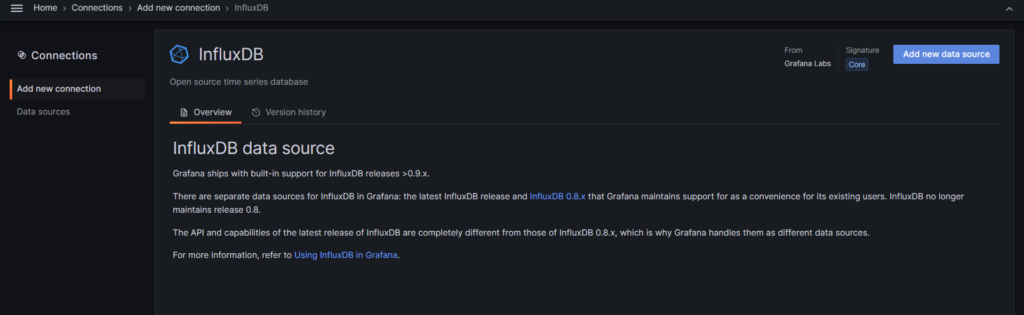
Add new data sourceをクリック。
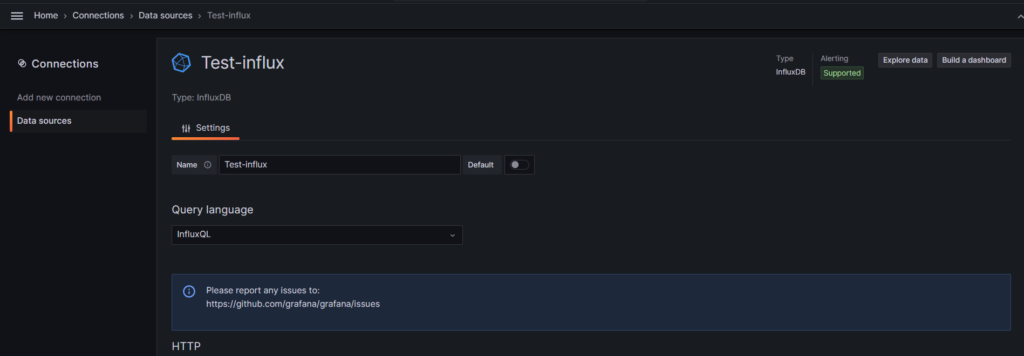
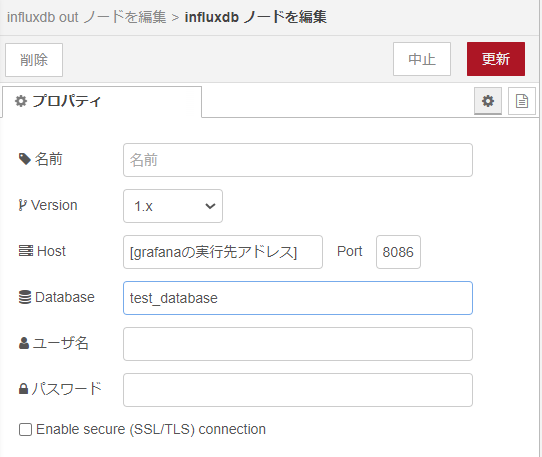
設定画面が開きます。
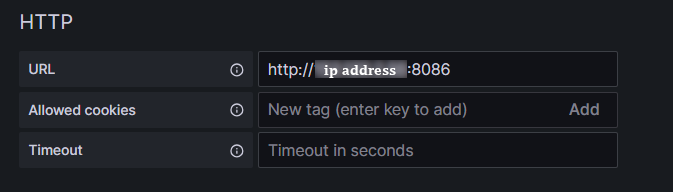
Grafanaの実行元 IP のポート8086。
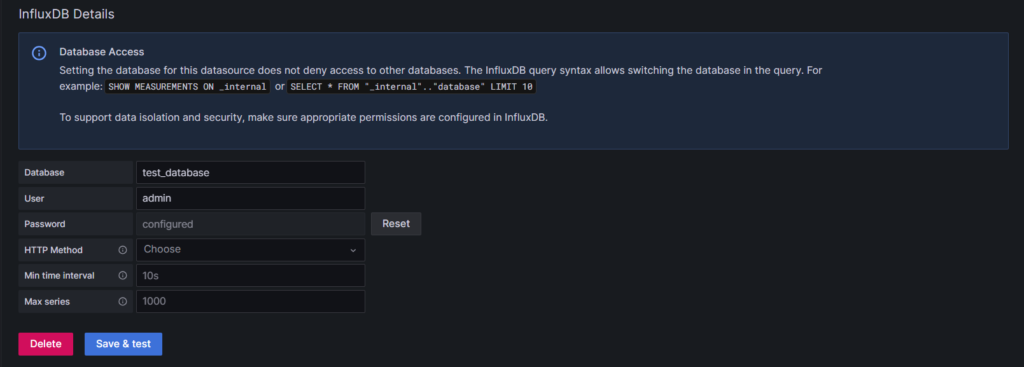
データベース名、User名・パスワードを入力。
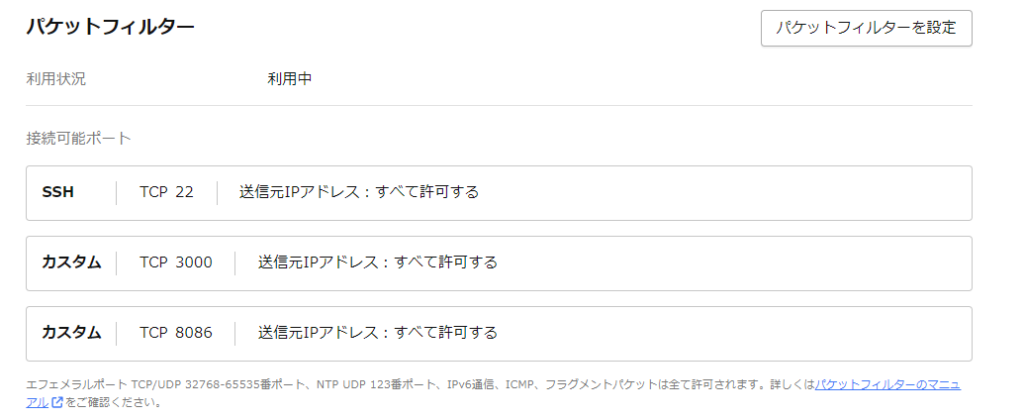
GrafanaをさくらのVPSで開いているため、使用するポート8086のパケットフィルターを設定しておきました。
ダッシュボードのセット
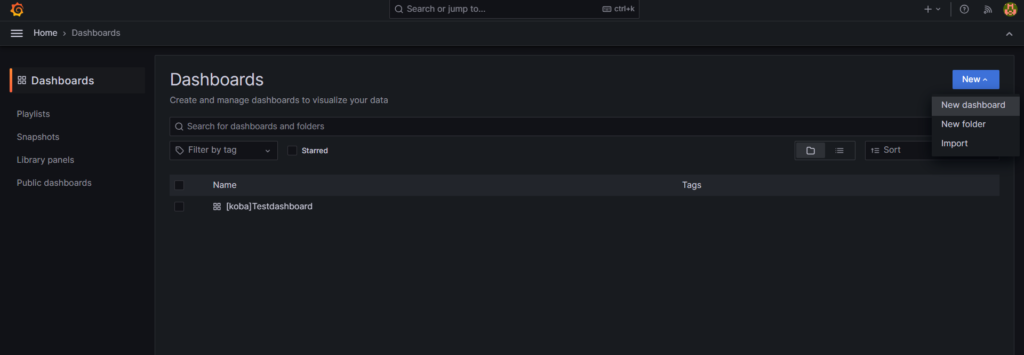
画面左上の「≡」からDashboardsを開き、新規でダッシュボードを作成します。
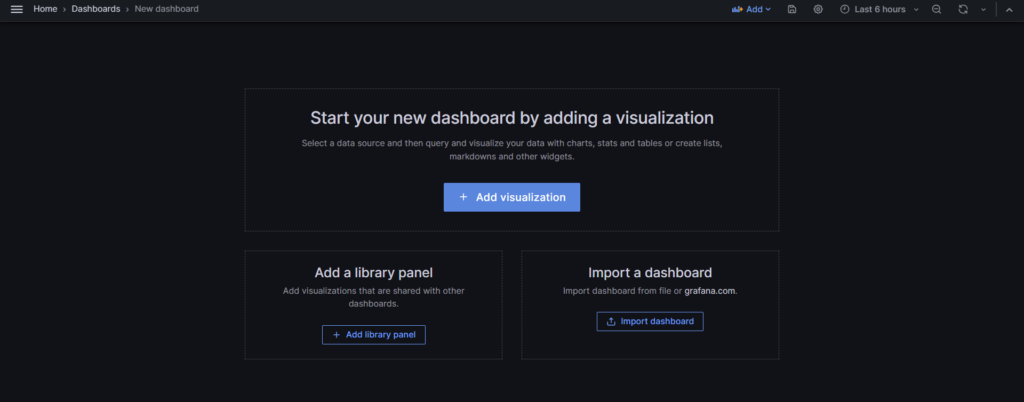
Add visualizationを選択。
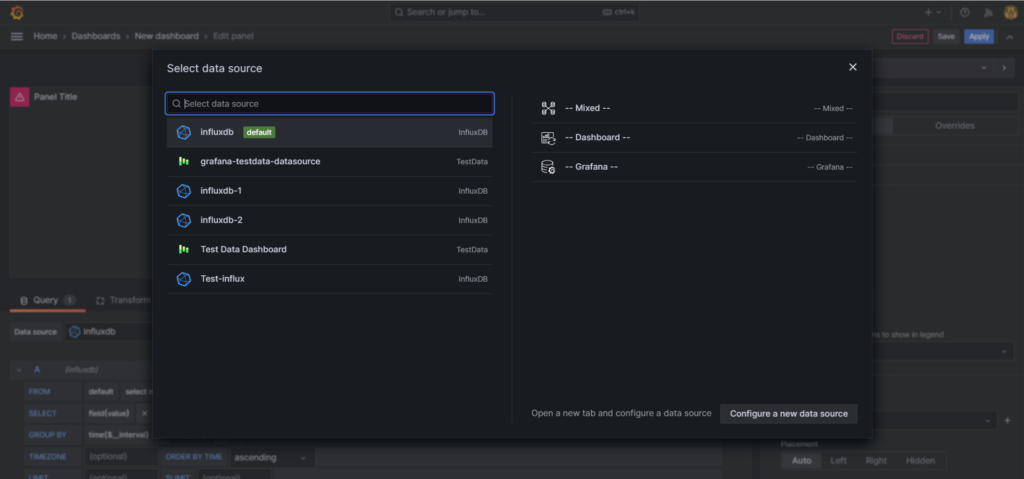
先ほど作成しておいた名前のinfluxDB(Test-influx)を選択します。
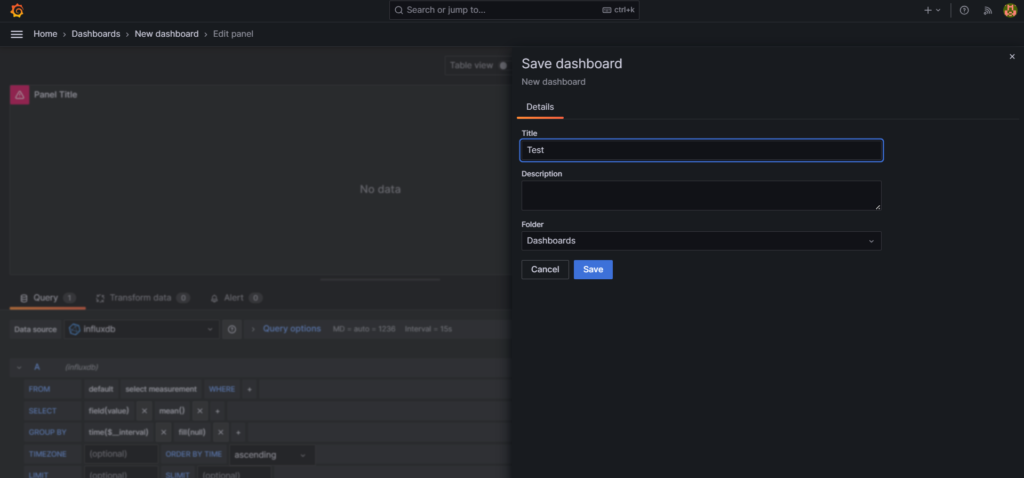
エディター画面に遷移したら、右上からsaveをしておきます。
Node REDの準備
node-red-contrib-influxdb のインストール
パレットからインストール、または https://flows.nodered.org/node/node-red-contrib-influxdb からCmdでインストール。
下記ノードが追加されます。
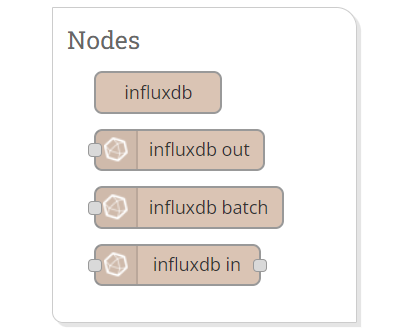
今回はNode RED側からinfluxDBにデータを送信するため、influxdb outを使用します。
フローの作成
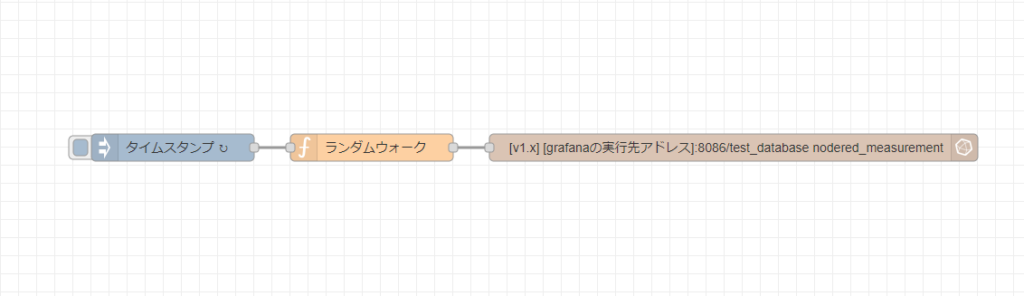
今回はランダムウォークのプログラムをfunctionノードで2秒間隔で走らせて、Grafanaに送信しています。
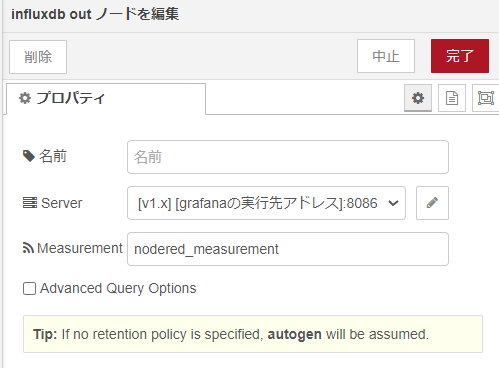
influxDB 作成時に設定した test_database という名前のデータベースに、任意の名前のmeasurementに格納していきます。(今回はtest_measurement)
確認方法
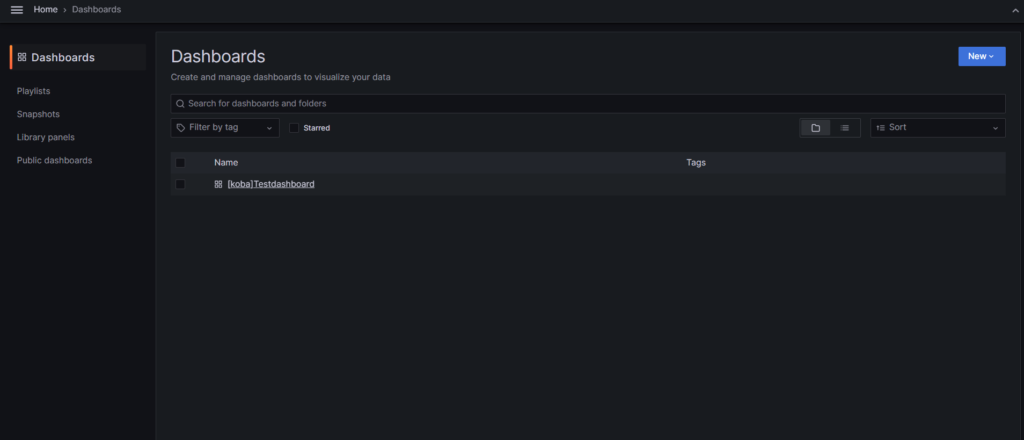
Grafana画面左上の「≡」からDashboardsを開き、作成したDashboardを選択します。
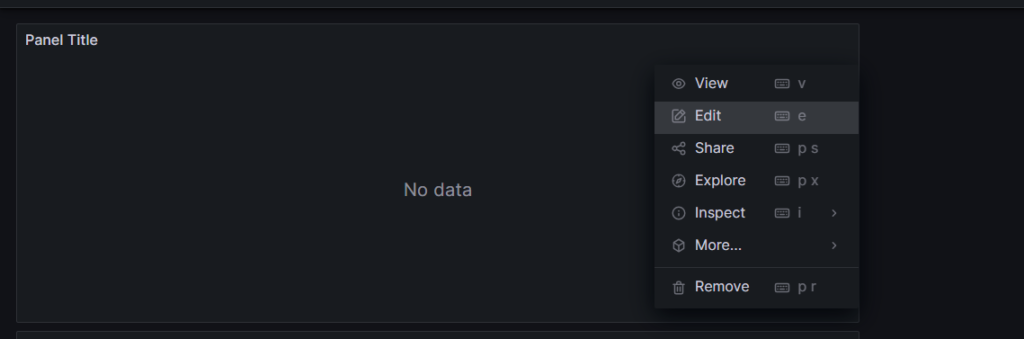
Panelの「︙」からEditを選択しエディターを開きます。
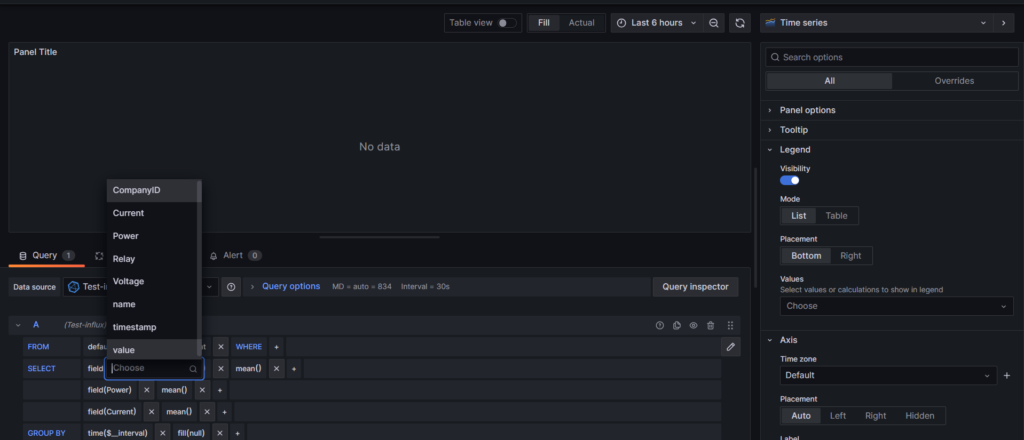
今回payloadにvalueという名前でデータを格納したので、nodered_measurementのvalueというfieldを選択します。
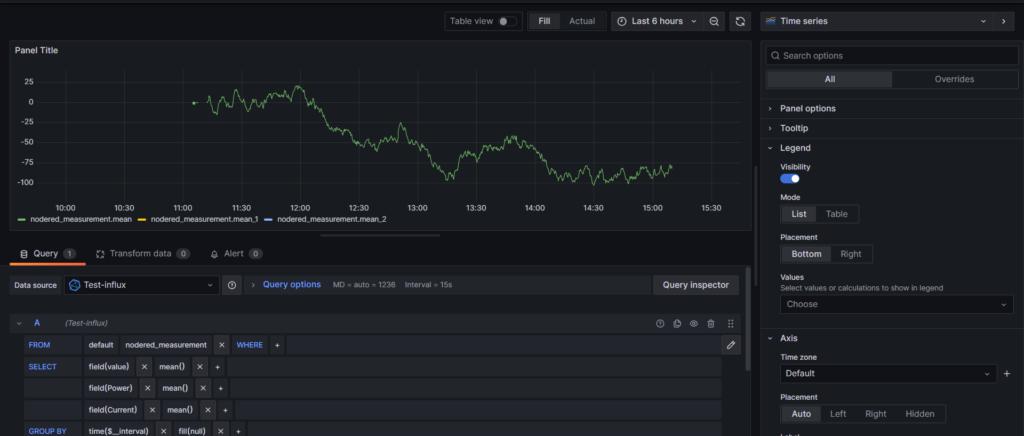
データが反映されていることがわかります。
画面右側でパネルの体裁など詳細設定ができます。
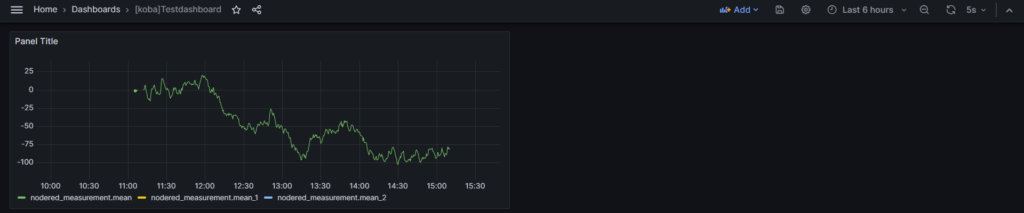
Applyすることで、選択したfieldのグラフを固定表示することができます。
同様にinfluxdb outノードにセンサデータ等を入れれば、簡単に可視化することができます。
フローデータ
[ { "id": "fef8886ba18fb157", "type": "inject", "z": "c836091b6da91e2f", "name": "", "props": [ { "p": "payload" }, { "p": "topic", "vt": "str" } ], "repeat": "2", "crontab": "", "once": false, "onceDelay": 0.1, "topic": "", "payload": "", "payloadType": "date", "x": 390, "y": 280, "wires": [ [ "3d92f004976a3abf" ] ] }, { "id": "3d92f004976a3abf", "type": "function", "z": "c836091b6da91e2f", "name": "ランダムウォーク", "func": "// ランダムウォークのプログラム\nfunction generateRandomWalk(currentValue) {\n // ランダムに+1または-1を選び、現在の値に加算する\n const step = Math.random() < 0.5 ? -1 : 1;\n return currentValue + step;\n}\n\n// メインのランダムウォーク関数\nfunction getRandomWalk() {\n // flow contextから現在の値を取得するか、初期値を設定\n let currentValue = flow.get(\"currentValue\") || 0;\n\n return function () {\n currentValue = generateRandomWalk(currentValue);\n\n // flow contextに現在の値を保存\n flow.set(\"currentValue\", currentValue);\n\n return currentValue;\n };\n}\n\n// ランダムウォーク関数のインスタンスを生成\nconst randomWalk = getRandomWalk();\n\n// ランダムウォークの値を生成してmsg.payloadに格納\nmsg.payload = {\n value: randomWalk()\n};\n\n// Node-RED上でメッセージを送信\nnode.send(msg);\n", "outputs": 1, "timeout": 0, "noerr": 0, "initialize": "", "finalize": "", "libs": [], "x": 610, "y": 280, "wires": [ [ "cc23d388aad7bce5" ] ] }, { "id": "cc23d388aad7bce5", "type": "influxdb out", "z": "c836091b6da91e2f", "influxdb": "a714e7a0ba5e0f1f", "name": "", "measurement": "nodered_measurement", "precision": "", "retentionPolicy": "", "database": "database", "precisionV18FluxV20": "ms", "retentionPolicyV18Flux": "", "org": "organisation", "bucket": "bucket", "x": 990, "y": 280, "wires": [] }, { "id": "a714e7a0ba5e0f1f", "type": "influxdb", "hostname": "[grafanaの実行先アドレス]", "port": "8086", "protocol": "http", "database": "test_database", "name": "", "usetls": false, "tls": "", "influxdbVersion": "1.x", "url": "http://localhost:8086", "timeout": "10", "rejectUnauthorized": true } ]